
“Huvitz publishes this white paper to communicate the clinical value of ophthalmic technologies and to support a better understanding of accurate and consistent diagnosis in clinical practice.”
Executive Summary
This white paper presents clinical interpretation strategies for OCT-based structural indicators, including RNFL and GCC, to improve the precision of glaucoma diagnosis and progression assessment.
※ This white paper series consists of three parts. In this first volume, we explore why OCTis important in glaucoma diagnosis and the key interpretation principles of RNFL- and GCC-based structural analysis.
Glaucoma is a chronic progressive optic neuropathy characterized by the gradual loss of retinal ganglion cells (RGCs) and their axons. Functional assessments such as visual field testing have limitations because abnormalities often become apparent only after substantial structural damage has already occurred. As a result, the role of OCT in quantitatively detecting structural changes at an early stage has become increasingly important.
The introduction of OCT provided clinical evidence that structural damage can precede functional loss, shifting the diagnostic paradigm of glaucoma toward a structure-based approach. In particular, quantitative indicators such as RNFL (Retinal Nerve Fiber Layer) and GCC (Ganglion Cell Complex) have enabled more sensitive detection of early glaucomatous damage and more objective monitoring of disease progression.
Key OCT Indicators: RNFL and GCC
The first concepts to understand in glaucoma OCT interpretation are RNFL and GCC. These two indicators reflect different anatomical layers and structural information and serve as key parameters for evaluating glaucomatous structural damage. In particular, the clinical significance and interpretive focus of each indicator may vary depending on the stage of the disease.
1. RNFL (Retinal Nerve Fiber Layer): Peripapillary Axonal Analysis
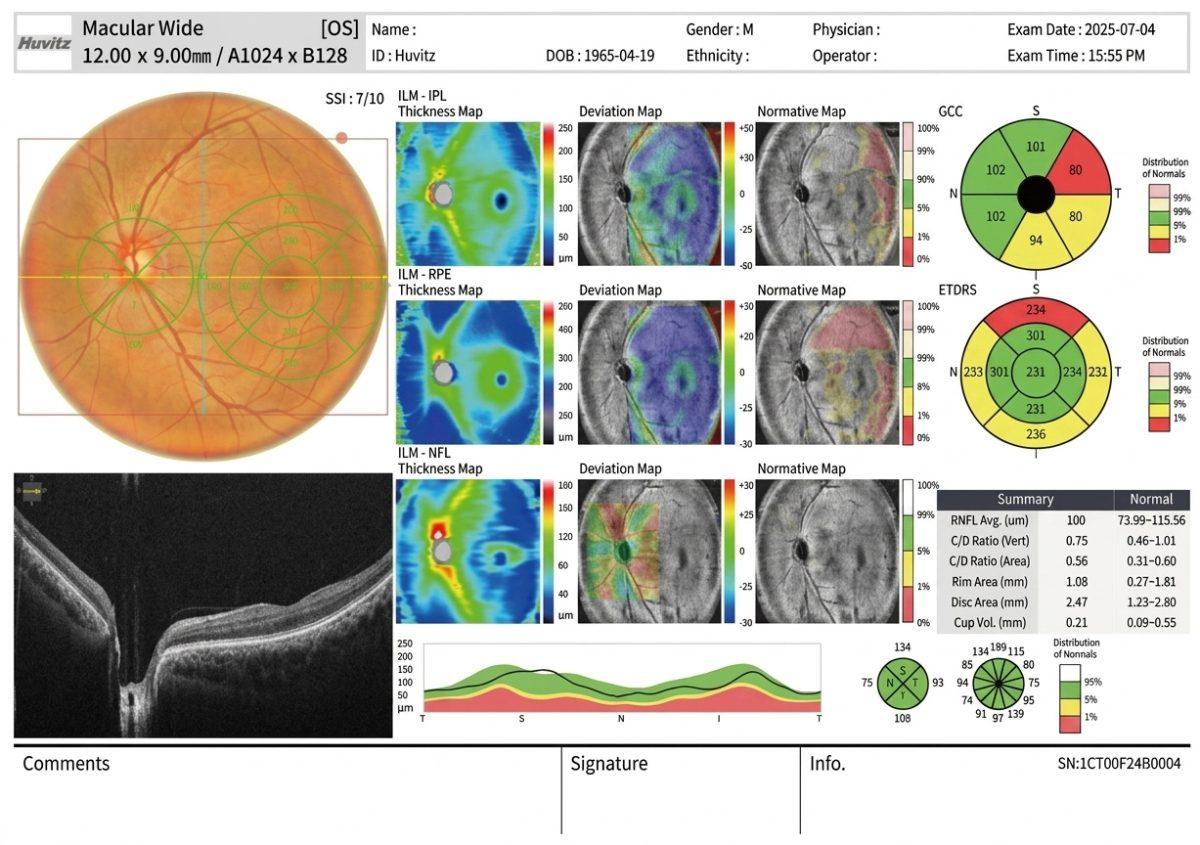
RNFL (Figure 1) represents the region where retinal ganglion cell axons are concentrated, with the superior and inferior arcuate nerve fiber bundles being particularly vulnerable to glaucomatous damage.
1-1. Prioritize Pattern-Based Interpretation
- Wedge-shaped defects in the ST/IT sectors
- Localized and asymmetric thinning
- Superior–inferior hemispheric thickness asymmetry
1-2. Evaluation of Localized Abnormalities on the Deviation Map
Abnormal findings observed on the deviation map should be evaluated in relation to the anatomical arrangement of retinal nerve fiber bundles. Considering the possibility of false positives, interpretation should be performed in conjunction with the original B-scan images and overall clinical findings.
1-3. Emphasis on Longitudinal Change (Trend)
Glaucoma progression should be assessed based on the annual rate of change (slope) observed during follow-up examinations rather than relying solely on measurements from a single visit.
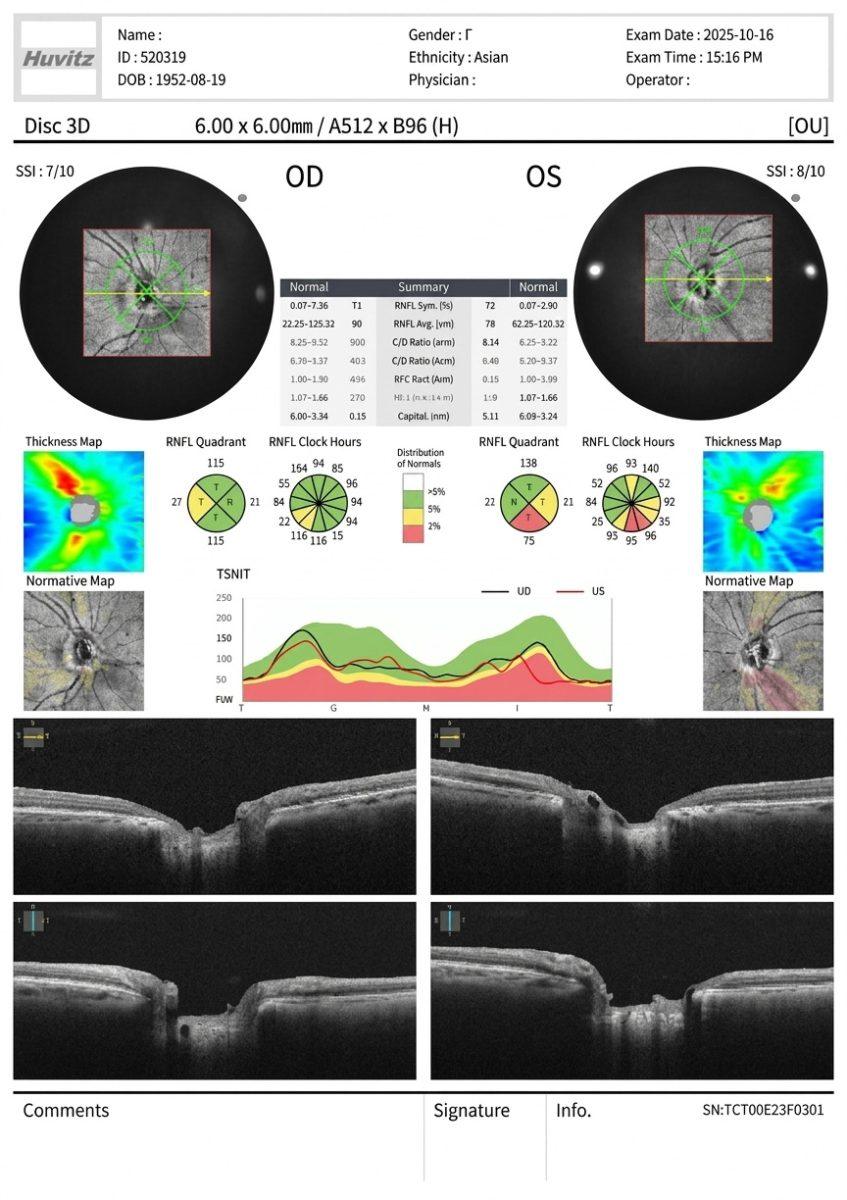
* Data obtained using the Huvitz OCT System (OCTavius)
<Figure1> OCT Report for RNFL and Optic Nerve Head Analysis in a Glaucoma
Patient
2. GCC (Ganglion Cell Complex): Macular Retinal Ganglion Cell Analysis
2-1. Evaluation of Localized Thinning Patterns
2-2. Assessment of Macular Asymmetry
Thinning in the superotemporal (ST) region is strongly associated with inferior visual field defects, while inferotemporal (IT) thinning corresponds to superior visual field defects. Interpretation should focus on localized and asymmetric damage patterns rather than diffuse or uniform thinning.
2-3. Central Structure–Function Correlation and Stage-Specific Application
* Data obtained using the Huvitz OCT System (OCTavius)
RNFL and GCC should not be considered competing indicators, but rather complementary structural parameters. In clinical practice, it is not uncommon for RNFL findings to appear normal while GCC demonstrates abnormalities, or vice versa. Therefore, both indicators should always be evaluated together. Because each parameter reflects different anatomical information, integrated interpretation is essential for more accurate assessment of glaucomatous structural damage.
In this first volume, we explored the clinical significance of OCT in glaucoma diagnosis and the key interpretation principles of RNFL and GCC indicators. Moving beyond reliance on average values to recognize localized patterns, and integrating both structural indicators in interpretation, forms the foundation of accurate glaucoma OCT assessment.
In the second volume, we will examine stage-specific OCT interpretation strategies for early and advanced glaucoma, focusing on how structural OCT indicators should be interpreted and applied according to disease severity.
Key Terminology
| Term | Definition |
|---|---|
| RNFL (Retinal Nerve Fiber Layer) | A layer composed of retinal ganglion cell axons surrounding the optic disc, serving as a primary structural indicator for evaluating glaucomatous damage. |
| GCC (Ganglion Cell Complex) | A structural indicator reflecting the macular region where retinal ganglion cell bodies are densely concentrated, used to evaluate glaucomatous damage. |
| Deviation Map | A map that displays statistically significant deviations by comparing patient data with a normative database, commonly used to assess localized defect patterns. |
| Floor Effect | A measurement limitation in which additional neural loss is not adequately reflected once RNFL thickness decreases below a certain threshold. |
| False Positive | A case in which test results are interpreted as abnormal despite the absence of actual pathological damage. |
FAQ
Q1. Can glaucoma still be suspected even if the average RNFL thickness is within the normal range?
A. Yes. In early glaucoma, localized RNFL thinning often appears first in the superotemporal or inferotemporal sectors, even when the global average RNFL thickness remains within the normal range. Therefore, it is important to evaluate localized defect patterns on the deviation map rather than relying solely on average thickness values.
Q2. Which OCT indicator should be prioritized, RNFL or GCC?
A. Because RNFL and GCC reflect different anatomical information, the most appropriate approach is to interpret both indicators together. RNFL evaluates retinal nerve fiber axons surrounding the optic disc, whereas GCC assesses the retinal ganglion cell bodies within the macular region. Integrated analysis of both parameters provides a more comprehensive understanding of glaucomatous structural damage.
Q3. Why should OCT and visual field testing be interpreted together?
A. In glaucoma, structural and functional changes do not always appear at the same time. In some patients, OCT-based structural abnormalities may precede functional loss, while in others, functional changes on visual field testing may become apparent earlier. Therefore, a structure–function integrated approach combining OCT structural analysis and visual field testing is essential for more accurate diagnosis and progression assessment.
Authors and Clinical Review
| Clinical Review |
Joong Jae Lee, Clinical Research & Validation Team, Huvitz Chang Woo Kim, Clinical Research & Validation Team, Huvitz |
| Medical Advisory | Kyung Jin Cho, MD, PhD, Associate Professor and Head, Department of Ophthalmology, Dankook University College of Medicine |
| Author | Sebeen Cho, IMC Marketing Team, Huvitz |
Disclaimer
- This white paper has been prepared to support the understanding of OCT- based ophthalmic diagnostic technologies and does not replace medical diagnosis or treatment for individual patients. All clinical decisions regarding diagnosis and treatment should be made by qualified ophthalmologists.
- The content of this white paper may vary depending on regional medical standards, regulations, and clinical environments, and its application and interpretation should be determined by healthcare professionals.
- Clinical images and data included in this document were obtained using OCT technology, and actual results may vary depending on device specifications and patient conditions.
- The images and data presented in this white paper are intended for illustrative purposes only and may not represent all clinical cases.
- The information contained in this white paper is based on knowledge available at the time of publication and may be subject to change according to future clinical findings or updated standards.
- While this white paper references Huvitz OCT technology for illustrative purposes, it is not intended as a product advertisement or sales recommendation.
- The authors, publisher, and contributors assume no legal responsibility for any outcomes resulting from the use of this material.
- By accessing or using this white paper, you acknowledge and agree to the terms of this disclaimer.
References
1. Lee, Y. J., Park, K. H., & Jeoung, J. W. (2023). False-positive classification and associated factors in segmented macular layers and retinal nerve fiber layer analysis: Spectralis OCT deviation map study. Scientific Reports, 13(1), 6782.
2. Swaminathan, S. S., Wu, X., Zhou, M., et al. (2021). Rapid initial OCT RNFL thinning is predictive of faster visual field loss during extended follow-up in glaucoma. American Journal of Ophthalmology, 229, 100–107.
3. Zheng, F., Yu, M., & Leung, C. K.-S. (2020). Diagnostic criteria for detection of retinal nerve fibre layer thickness and neuroretinal rim width abnormalities in glaucoma. British Journal of Ophthalmology, 104(2), 270–275.
4. Ghita, A. M., Iliescu, D. A., Ghita, A. C., Ilie, L. A., & Otobic, A. (2023). Ganglion cell complex analysis: correlations with retinal nerve fiber layer on optical coherence tomography. Diagnostics, 13(2), 266.
5. Hood, D. C., Raza, A. S., de Moraes, C. G., Liebmann, J. M., & Ritch, R. (2022). The 24-2 visual field guided progression analysis can miss the progression of glaucomatous damage of the macula seen using OCT. Ophthalmology Glaucoma, 5(6), 614–627.