

“Huvitz publishes this white paper to communicate the clinical value of ophthalmic technologies and to support a better understanding of accurate and consistent diagnosis in clinical practice.”
Executive Summary
This white paper presents clinical interpretation strategies for OCT-based structural indicators, including RNFL and GCC, to improve the precision of glaucoma diagnosis and progression assessment.
In early-stage glaucoma, interpretation should focus less on the global average thickness and more on localized defects in the superotemporal (ST) and inferotemporal (IT) sectors, as well as superior–inferior hemispheric asymmetry patterns.
1. Provides an integrated understanding of RNFL and GCC indicators to evaluate structural changes at both the retinal ganglion cell axon and cell body levels.
2. Interprets glaucoma findings according to disease stage, focusing on localized damage patterns rather than average values in early stages, and on longitudinal trends rather than isolated measurements in advanced stages.
3. Presents more accurate clinical interpretation criteria by considering false positives and deviation map artifacts that may occur in highly myopic eyes.
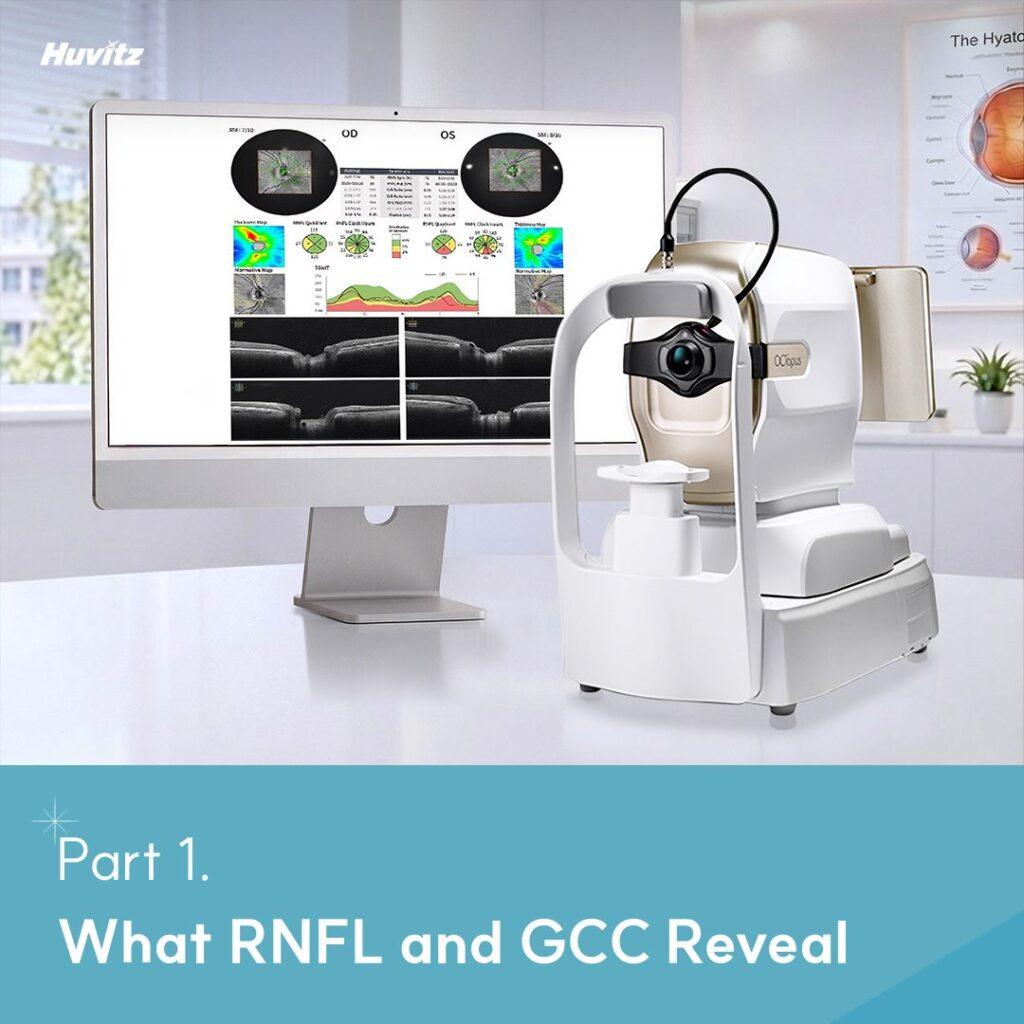
※ This white paper series consists of three parts. In this first volume, we explore why OCTis important in glaucoma diagnosis and the key interpretation principles of RNFL- and GCC-based structural analysis.
In the second volume of this series, we explore how OCT structural parameters should be interpreted in both early and advanced glaucoma. We introduce stage-specific interpretation strategies that focus on localized damage patterns in early disease and longitudinal trend analysis in progressive disease.
In the first volume, we reviewed the clinical significance of OCT in glaucoma diagnosis and the anatomical structures represented by RNFL and GCC, along with the fundamental principles of interpretation. We highlighted that localized defects, asymmetry, and integrated interpretation of RNFL and GCC are more important than average thickness values alone when assessing structural glaucomatous damage.
In clinical practice, however, OCT interpretation strategies should vary according to disease stage. In early glaucoma, identifying subtle structural damage hidden behind normal average values requires careful evaluation of localized defect patterns. In more advanced disease, interpretation should focus on longitudinal trends and rates of change rather than absolute thickness values at a single time point. Furthermore, integrating structural OCT findings with visual field testing plays an important role in understanding disease progression more accurately.
This paper explores stage-specific OCT interpretation strategies and discusses how RNFL and GCC can be clinically applied in both early and progressive glaucoma.
Early Glaucoma Strategy: Read the Pattern, Not the Average
1. RNFL Interpretation Strategy: Localized Patterns Matter More Than Averages
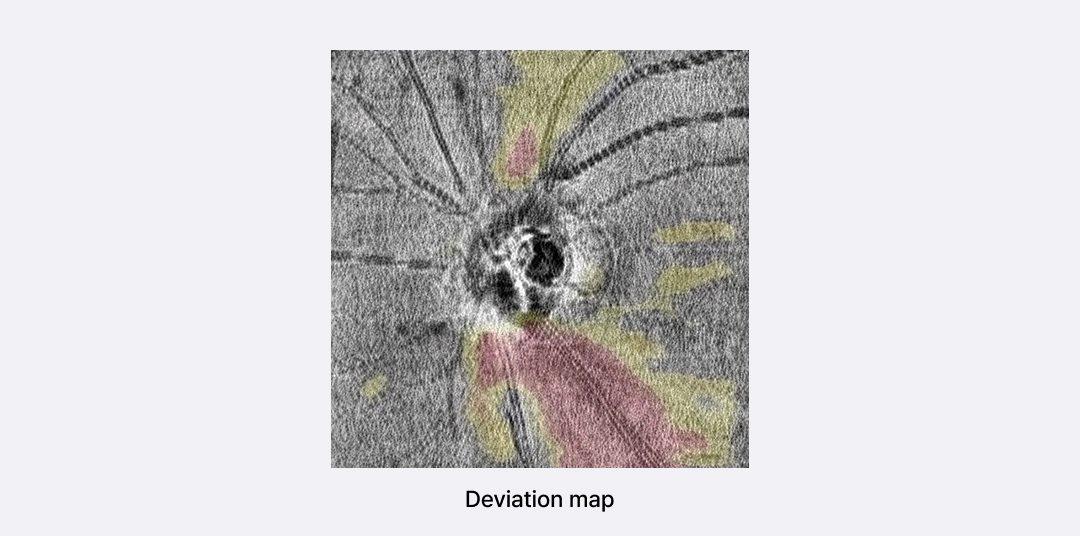
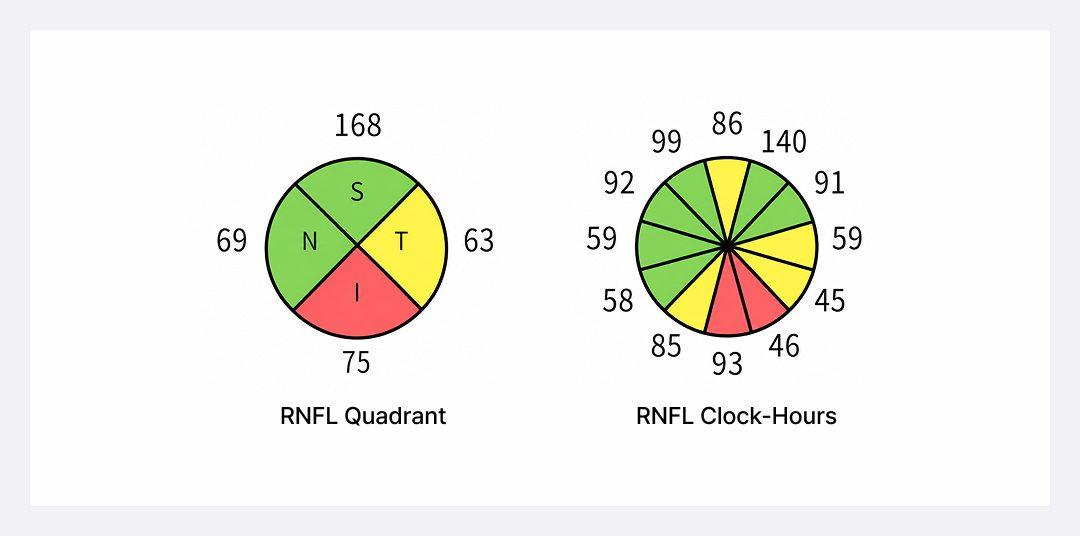
The fundamental principle of early glaucoma diagnosis is not to draw conclusions based on average values but to identify structural patterns and relate them to anatomical and clinical findings (Figure 1).
2. Early Detection with GCC: Macular Damage May Appear Before RNFL Changes
Clustered localized abnormalities on deviation/probability maps
Superior–inferior GCC asymmetry
Central and parafoveal damage patterns
Executive Summary
This white paper presents clinical interpretation strategies for OCT-based structural
indicators, including RNFL and GCC, to improve the precision of glaucoma diagnosis and
progression assessment.
In early-stage glaucoma, interpretation should focus less on the global average thickness and more on localized defects in the superotemporal (ST) and inferotemporal (IT) sectors, as well
as superior–inferior hemispheric asymmetry patterns.
3. Presents more accurate clinical interpretation criteria by considering false positives and
deviation map artifacts that may occur in highly myopic eyes.
3. Progressive Glaucoma Strategy: Track the Rate of Change, Not Just Thickness
Lorem ipsum dolor sit amet, consectetur adipiscing elit. Ut elit tellus, luctus nec ullamcorper mattis, pulvinar dapibus leo.
Lorem ipsum dolor sit amet, consectetur adipiscing elit. Ut elit tellus, luctus nec ullamcorper mattis, pulvinar dapibus leo.
Key Terminology
| Term | Definition |
|---|---|
| RNFL (Retinal Nerve Fiber Layer) | A layer composed of retinal ganglion cell axons surrounding the optic disc, serving as a primary structural indicator for evaluating glaucomatous damage. |
| GCC (Ganglion Cell Complex) | A structural indicator reflecting the macular region where retinal ganglion cell bodies are densely concentrated, used to evaluate glaucomatous damage. |
| Deviation Map | A map that displays statistically significant deviations by comparing patient data with a normative database, commonly used to assess localized defect patterns. |
| Floor Effect | A measurement limitation in which additional neural loss is not adequately reflected once RNFL thickness decreases below a certain threshold. |
| False Positive | A case in which test results are interpreted as abnormal despite the absence of actual pathological damage. |
FAQ
Q1. Can glaucoma still be suspected even if the average RNFL thickness is within the normal range?
A. Yes. In early glaucoma, localized RNFL thinning often appears first in the superotemporal or inferotemporal sectors, even when the global average RNFL thickness remains within the normal range. Therefore, it is important to evaluate localized defect patterns on the deviation map rather than relying solely on average thickness values.
Q2. Which OCT indicator should be prioritized, RNFL or GCC?
A. Because RNFL and GCC reflect different anatomical information, the most appropriate approach is to interpret both indicators together. RNFL evaluates retinal nerve fiber axons surrounding the optic disc, whereas GCC assesses the retinal ganglion cell bodies within the macular region. Integrated analysis of both parameters provides a more comprehensive understanding of glaucomatous structural damage.
Q3. Why should OCT and visual field testing be interpreted together?
A. In glaucoma, structural and functional changes do not always appear at the same time. In some patients, OCT-based structural abnormalities may precede functional loss, while in others, functional changes on visual field testing may become apparent earlier. Therefore, a structure–function integrated approach combining OCT structural analysis and visual field testing is essential for more accurate diagnosis and progression assessment.
Authors and Clinical Review
| Clinical Review |
Joong Jae Lee, Clinical Research & Validation Team, Huvitz Chang Woo Kim, Clinical Research & Validation Team, Huvitz |
| Medical Advisory | Kyung Jin Cho, MD, PhD, Associate Professor and Head, Department of Ophthalmology, Dankook University College of Medicine |
| Author | Sebeen Cho, IMC Marketing Team, Huvitz |
Disclaimer
- This white paper has been prepared to support the understanding of OCT- based ophthalmic diagnostic technologies and does not replace medical diagnosis or treatment for individual patients. All clinical decisions regarding diagnosis and treatment should be made by qualified ophthalmologists.
- The content of this white paper may vary depending on regional medical standards, regulations, and clinical environments, and its application and interpretation should be determined by healthcare professionals.
- Clinical images and data included in this document were obtained using OCT technology, and actual results may vary depending on device specifications and patient conditions.
- The images and data presented in this white paper are intended for illustrative purposes only and may not represent all clinical cases.
- The information contained in this white paper is based on knowledge available at the time of publication and may be subject to change according to future clinical findings or updated standards.
- While this white paper references Huvitz OCT technology for illustrative purposes, it is not intended as a product advertisement or sales recommendation.
- The authors, publisher, and contributors assume no legal responsibility for any outcomes resulting from the use of this material.
- By accessing or using this white paper, you acknowledge and agree to the terms of this disclaimer.
References
1. Lee, Y. J., Park, K. H., & Jeoung, J. W. (2023). False-positive classification and associated factors in segmented macular layers and retinal nerve fiber layer analysis: Spectralis OCT deviation map study. Scientific Reports, 13(1), 6782.
2. Swaminathan, S. S., Wu, X., Zhou, M., et al. (2021). Rapid initial OCT RNFL thinning is predictive of faster visual field loss during extended follow-up in glaucoma. American Journal of Ophthalmology, 229, 100–107.
3. Zheng, F., Yu, M., & Leung, C. K.-S. (2020). Diagnostic criteria for detection of retinal nerve fibre layer thickness and neuroretinal rim width abnormalities in glaucoma. British Journal of Ophthalmology, 104(2), 270–275.
4. Ghita, A. M., Iliescu, D. A., Ghita, A. C., Ilie, L. A., & Otobic, A. (2023). Ganglion cell complex analysis: correlations with retinal nerve fiber layer on optical coherence tomography. Diagnostics, 13(2), 266.
5. Hood, D. C., Raza, A. S., de Moraes, C. G., Liebmann, J. M., & Ritch, R. (2022). The 24-2 visual field guided progression analysis can miss the progression of glaucomatous damage of the macula seen using OCT. Ophthalmology Glaucoma, 5(6), 614–627.